Image Classification with PyTorch and Cleanlab#
This 5-minute cleanlab quickstart tutorial demonstrates how to find potential label errors in image classification data. Here we use the MNIST dataset containing 70,000 images of handwritten digits from 0 to 9.
Overview of what we’ll do in this tutorial:
Build a simple PyTorch neural net and wrap it with Skorch to make it scikit-learn compatible.
Compute the out-of-sample predicted probabilities,
psx, via cross-validation.Generate a list of potential label errors with Cleanlab’s
get_noise_indices.
1. Install the required dependencies#
Install the following dependencies with pip install:
cleanlab
pandas
matplotlib
torch
torchvision
skorch
2. Fetch and scale the MNIST dataset#
[3]:
from sklearn.datasets import fetch_openml

mnist = fetch_openml("mnist_784")  # Fetch the MNIST dataset

X = mnist.data.astype("float32").to_numpy()  # 2D numpy array of image features
X /= 255.0  # Scale the features to the [0, 1] range

y = mnist.target.astype("int64").to_numpy()  # 1D numpy array of the image labels
Bringing Your Own Data (BYOD)?
Assign your data’s features to variable X and its labels to variable y instead.
3. Define a classification model#
Here, we define a simple neural network with PyTorch.
[4]:
from torch import nn

model = nn.Sequential(
    nn.Linear(28 * 28, 128),
    nn.ReLU(),
    nn.Dropout(0.5),
    nn.Linear(128, 10),
    nn.Softmax(dim=-1),
)
4. Ensure your classifier is scikit-learn compatible#
As some of Cleanlab’s features requires scikit-learn compatibility, we will need to adapt the above PyTorch neural net accordingly. Skorch is a convenient package that helps with this. You can also easily wrap an arbitrary model to be scikit-learn compatible as demonstrated here.
[5]:
from skorch import NeuralNetClassifier

model_skorch = NeuralNetClassifier(model)
5. Compute out-of-sample predicted probabilities#
If we’d like Cleanlab to identify potential label errors in the whole dataset and not just the training set, we can consider using the entire dataset when computing the out-of-sample predicted probabilities, psx, via cross-validation.
[6]:
from sklearn.model_selection import cross_val_predict

psx = cross_val_predict(model_skorch, X, y, cv=3, method="predict_proba")
  epoch    train_loss    valid_acc    valid_loss     dur
-------  ------------  -----------  ------------  ------
      1        1.9845       0.7482        1.5712  0.9986
      2        1.2629       0.8020        0.9596  0.9132
      3        0.8940       0.8338        0.7255  0.9391
      4        0.7364       0.8493        0.6166  0.9282
      5        0.6544       0.8593        0.5528  0.9113
      6        0.5925       0.8677        0.5084  0.9149
      7        0.5556       0.8721        0.4772  0.9111
      8        0.5232       0.8756        0.4536  0.9569
      9        0.5002       0.8800        0.4335  0.9243
     10        0.4787       0.8832        0.4180  0.9266
  epoch    train_loss    valid_acc    valid_loss     dur
-------  ------------  -----------  ------------  ------
      1        1.9833       0.7598        1.5534  0.9128
      2        1.2569       0.8133        0.9337  0.9286
      3        0.8882       0.8388        0.6993  0.9154
      4        0.7325       0.8561        0.5885  0.9328
      5        0.6482       0.8685        0.5239  0.9243
      6        0.5932       0.8777        0.4802  0.9194
      7        0.5532       0.8834        0.4498  0.9269
      8        0.5223       0.8894        0.4260  0.9397
      9        0.4972       0.8930        0.4061  0.9689
     10        0.4730       0.8952        0.3914  0.9215
  epoch    train_loss    valid_acc    valid_loss     dur
-------  ------------  -----------  ------------  ------
      1        1.9989       0.7480        1.5723  0.9072
      2        1.2912       0.8127        0.9472  0.9356
      3        0.9270       0.8437        0.7059  0.9256
      4        0.7628       0.8627        0.5909  0.9296
      5        0.6765       0.8738        0.5246  0.9140
      6        0.6224       0.8825        0.4801  0.9168
      7        0.5802       0.8880        0.4477  0.9441
      8        0.5455       0.8922        0.4231  0.9218
      9        0.5216       0.8972        0.4040  0.9237
     10        0.4971       0.9006        0.3878  0.9386
6. Run Cleanlab to find potential label errors#
Cleanlab has a get_noise_indices function to generate a list of potential label errors. Setting sorted_index_method="prob_given_label" returns the indices of all the most likely label errors, sorted by the most suspicious example first.
[7]:
from cleanlab.pruning import get_noise_indices

ordered_label_errors = get_noise_indices(
    s=y, psx=psx, sorted_index_method="prob_given_label"
)
7. Review some of the most likely mislabeled examples#
[8]:
print(f"Cleanlab found {len(ordered_label_errors)} potential label errors.")
print(
    f"Here are the indices of the top 15 most likely ones: \n {ordered_label_errors[:15]}"
)
Cleanlab found 1235 potential label errors.
Here are the indices of the top 15 most likely ones:
 [24798 18598  8729 20820 31134 12679 15942  1352  7010 55739 39457 53216
 20735 11208 26376]
We’ll define a new plot_examples function to display any examples in a subplot conveniently.
Click here to view its code.
[9]:
import matplotlib.pyplot as plt


def plot_examples(id_iter, nrows=1, ncols=1):
    for count, id in enumerate(id_iter):
        plt.subplot(nrows, ncols, count + 1)
        plt.imshow(X[id].reshape(28, 28), cmap="gray")
        plt.title(f"id: {id} \n label: {y[id]}")
        plt.axis("off")

    plt.tight_layout(h_pad=2.0)
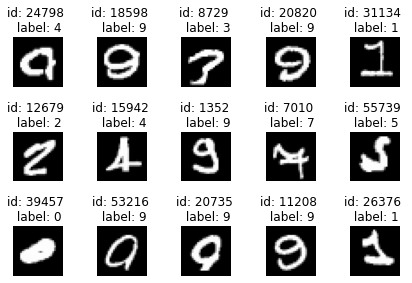
Let’s start by having an overview of the top 15 most likely label errors. From here, we can see a few label errors and edge cases. Feel free to change the parameters to display more or fewer examples.
[10]:
plot_examples(ordered_label_errors[range(15)], 3, 5)
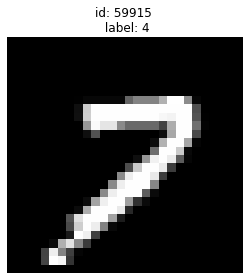
Let’s zoom into specific examples:
Given label is 4 but looks more like a 7
[11]:
plot_examples([59915])
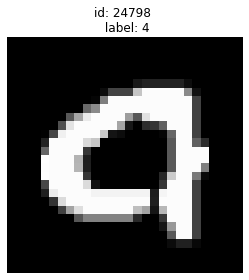
Given label is 4 but also looks like 9
[12]:
plot_examples([24798])
Edge case of odd looking 9s
[13]:
plot_examples([18598, 1352, 61247], 1, 3)
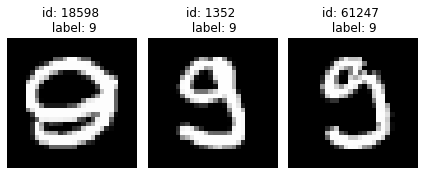
Cleanlab has shortlisted the most likely label errors to speed up your data cleaning process. With this list, you can decide whether to fix label errors, augment edge cases, or remove obscure examples.
What’s next?#
Congratulations on completing this tutorial! Check out our following tutorial on using Cleanlab for text classification, where we found hundreds of potential label errors in one of the most well-known text datasets, the IMBDb movie review dataset!